


On Wednesday, Exxon Mobil’s shares entered what is termed “oversold territory,” reflecting a significant drop in their trading price, which fell to as low as $111.42 per share. In technical trading analysis, the concept of “oversold” is quantified using the Relative Strength Index (RSI), an indicator that gauges momentum on a scale from zero to 100. According to standard practice, a stock is classified as oversold when its RSI falls below the threshold of 30. This phenomenon can suggest that a stock has been subject to heavy selling and may be poised for a potential rebound, making it an interesting topic for technical traders and bullish investors.
The current RSI for Exxon Mobil stands at 29.5, positioning it right on the cusp of being classified as oversold. For context, the average RSI for energy stocks in the broader market is reported at 47.1, which indicates that many of these stocks are not experiencing the same level of selling pressure. In addition, key benchmarks such as WTI Crude Oil and Henry Hub Natural Gas showcase healthier RSI levels, at 50.0 and 61.1, respectively. The 3-2-1 Crack Spread, a metric often used by refiners, indicates an even stronger momentum with an RSI of 79.8. These comparisons signify that Exxon Mobil’s recent price movement is notably divergent from broader market trends within the energy sector, potentially drawing the attention of investors looking for value.
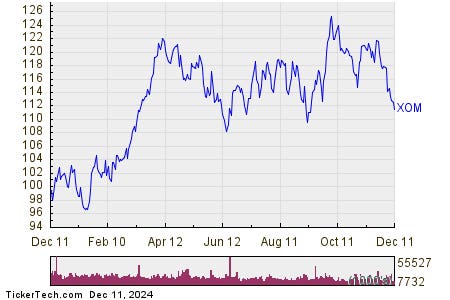
From a historical perspective, a look at Exxon Mobil’s one-year performance reveals a significant range in share prices, with a low of $95.77 and a high of $126.34 within the past twelve months. The last traded price of $111.61 places the company’s shares slightly off by approximately 0.9% on the trading day. This range underscores the volatility and shifting dynamics that can characterize energy stocks, particularly in light of global market conditions, regulatory shifts, and fluctuating commodity prices. The current trading level is indicative of a market grappling with these fluctuations, capturing investor interest and invoking strategies around market timing and risk assessment.
For bullish investors, the RSI reading of 29.5 can be interpreted as a signal that the recent selling pressure could be nearing its peak and that a buying opportunity may be on the horizon. The RSI is particularly valuable in this context as it can serve as both a momentum indicator and a tool for identifying potential reversal points. As such, savvy investors may start to monitor Exxon Mobil closely for signs of a rebound, using the RSI alongside other indicators and market analysis to gauge the optimal timing for entering or increasing their stake in the stock.
Understanding the implications of an oversold condition like that of Exxon Mobil is critical for making informed trading decisions. The interplay between oil prices, economic indicators, and corporate performance can heavily affect stock values in the energy sector. As Exxon Mobil navigates these challenges, the current oversold reading may provide a unique window for traders seeking to capitalize on potential rebounds that arise from short-term price dislocations. Moreover, monitoring market trends, global geopolitical factors, and energy demand will be essential for assessing the broader implications of such trading signals.
In summary, Exxon Mobil’s recent entry into oversold territory marked by its RSI reading of 29.5 presents an intriguing scenario for potential investors, especially in a market where many energy stocks maintain healthier momentum. With its current trading range and historical performance highlighted, investors are facing a pivotal moment where strategic entry or further assessment could yield fruitful results. As the energy landscape continues to evolve, staying attuned to technical indicators such as the RSI will be paramount for trading decisions in this dynamic sector.


