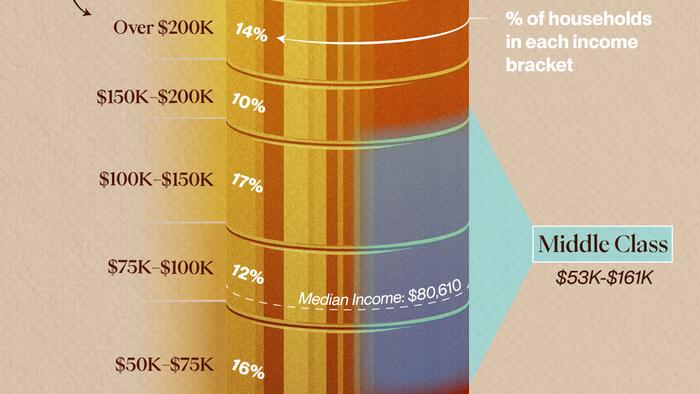
In 2023, a graphic from Visual Capitalist, illustrated by Pallavi Rao, presents a comprehensive visualization of U.S. household income distribution. According to Pew Research, a household is categorized as middle class if it earns between two-thirds to double the median annual income, which varies by state. However, for the purpose of this analysis, the overall U.S. median income is utilized as a benchmark. This data relies on information from the Census Bureau, and all figures have been adjusted for inflation. The median income for American households has been established at $80,060, thus defining the middle class as those earning between $53,000 and $161,000. This range encompasses roughly 40% of all U.S. households, indicating that a significant portion of the population falls within this economic bracket.
A closer examination reveals the detailed breakdown of household incomes across the nation. The largest segment, representing 17% of households, falls within the $100,000-$150,000 annual salary range. This is followed closely by the $50,000-$75,000 category, which accounts for 15.7% of households. These two ranges effectively outline the upper and lower boundaries of the middle class. Additionally, a noteworthy observation is that households earning $200,000 and above account for 14.4% of the income distribution, making it the third-largest cohort. This emergence of higher income brackets reflects changing economic dynamics and the growing income disparity in the U.S.
Understanding the historical context of the middle class is vital to grasp its current significance. The modern middle class traces its origins back to the Industrial Revolution when a new social strata emerged between the traditional aristocracy and the impoverished working class. During this era, professionals, skilled laborers, and merchants were able to leverage the economic transformation to improve their financial standing. The growth of this middle class played a pivotal role in shaping societies, as it created a buffer that reduced extreme class divisions, enabling economic stability and fostering upward mobility for many.
The relevance of a robust middle class extends beyond historical context; it has substantial implications for economic performance and societal well-being. A financially stable middle class serves as a crucial consumer base, driving demand for goods and services. This, in turn, stimulates productive investments and fosters economic growth. Additionally, the expansion of the middle class has been directly associated with reduced poverty levels and improvements in social policies across various nations. When a significant segment of the population is economically stable, it creates a stronger foundation for social cohesion and community resilience.
Visual representations of economic data, such as the one featured by Rao, are instrumental in understanding the intricate dynamics of income distribution. They provide an accessible way to interpret complex information, allowing citizens and policymakers alike to recognize patterns and trends that may influence economic decision-making. This visualization not only highlights the current distribution of income but also underscores the ongoing challenges and disparities that exist within the American economy.
In conclusion, the 2023 income distribution data delineates a striking portrait of American households and their economic standings. With significant portions of the population identified as middle class, it underscores the importance of this demographic in sustaining economic stability and driving growth. As historical contexts and contemporary realities converge, the middle class remains a vital feature of the American landscape, shaping not only the economy but also the social fabric of the nation. Understanding these dynamics is crucial for future policymakers as they strive to address income inequality and promote equitable economic progress.

