


The current market environment has provoked a thorough analysis of volatility measures, particularly in comparison to historical precedents, including the 2008 Global Financial Crisis (GFC), the COVID-19 pandemic, the Long-Term Capital Management (LTCM) crisis of 1998, and the Dotcom bubble. By examining indices such as the S&P 500 implied volatility (VIX), the government bond implied volatility (MOVE), and BBB credit spreads, I aimed to understand the underlying risk dynamics. Given the differences in scale among these measures, assessing what constitutes a normal volatility level becomes inherently challenging. To overcome these complexities, I employed percentile distributions over rolling 10-year windows, allowing for a standardized comparison across these diverse volatility metrics. This method assigns scores based on their historical standings, revealing where current volatility levels reside in relation to the past decade.
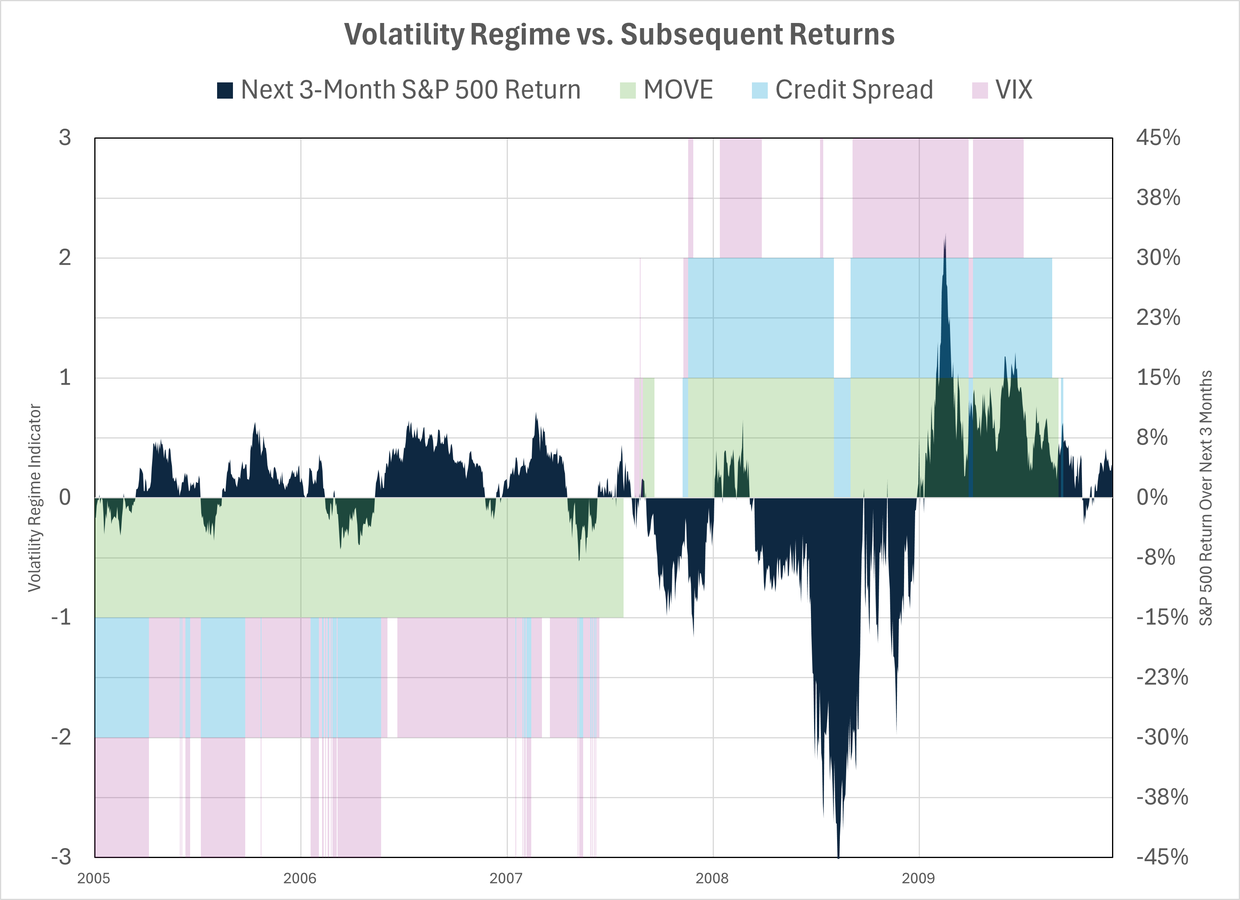
To categorize these volatility levels further, I defined parameters distinguishing low and high volatility regimes. Measurements at or below the 25th percentile were classified as “low vol,” receiving a score of -1, while those at or above the 75th percentile were considered “high vol” with a score of +1. All other readings were deemed neutral, assigned a score of 0. Plotting these scores against significant market distress events sheds light on the circumstances preceding major downturns. For instance, reflecting on the GFC, the lead-up was marked by an anomalously low-volatility environment, particularly characterized by government bonds and equity volatility remaining subdued. This low-vol state during the years preceding the crisis hints at the build-up of risks within a carry-trade dominated market that ultimately led to a severe market correction when volatility finally spiked.
Examining various crises, the pattern of low volatility before significant market events continues in the analysis of the COVID-19 pandemic. A comparable period of low volatility extended into 2020, crystallizing the notion that prolonged periods of suppressed volatility often foreshadow market corrections. In contrast, the LTCM crisis in 1998 presented a more nuanced illustration; there were fewer instances of simultaneous low-vol activity across multiple indicators, yet a general low-vol environment preceded the event. The timeline in this case reflects lesser magnitude in carry trades compared to either the GFC or the COVID-19 crisis but nonetheless illustrates the connection between low volatility regimes and subsequent market disruptions.
Differentiating the Dotcom bubble from these more recent events poses an intriguing challenge. The collapse in equity was preceded by a phase associated with normal to elevated volatility, distinguishing it as more of an adjustment driven by speculative overindulgence rather than a typical carry trade unwind triggered by low volatility. Despite suffering significant losses and economic repercussions, this episode did not escalate into a financial crisis, in stark contrast to the GFC and the COVID crash, which were characterized by systemic deleveraging and broader market panic. This distinction illustrates that not all periods of elevated market activity lead to catastrophic financial fallout, a factor worth noting in the current assessment of risk.
The analysis of the current market conditions suggests a mixed volatility environment. Recent valuations indicate elevated levels for the S&P 500, though not necessarily under the persistently low-vol regimes seen prior to notable market crashes. In mid-2024, low volatility seemed to manifest briefly, only to shift as volatility normalized due to external pressures such as geopolitical events or financial system tensions. The current situation appears less volatile overall, bearing semblance to the Dotcom period instead of the cataclysmic fluctuations seen in prior crises. However, this could lead to the risk of gradual pullbacks rather than sharp market corrections, while the potential for hidden leverage signals the need for caution lest a significant downturn trigger a broader financial crisis.
In summary, a comparative evaluation of valuation metrics on the eve of historical downturns unveils nuances not initially visible through volatility alone. Both the GFC and COVID crises transpired without equities demonstrating bubble-like valuations at their peaks, indicating a systemic response to underlying economic pressures rather than purely speculative excesses. As the financial world grapples with current market valuations, the oscillating patterns in volatility can inform potential future movements. While recent graphs raise no immediate alarms, they remind investors and analysts alike of the persistent risk factors lurking beneath a façade of stability. Ultimately, the quest to decipher these graphs and their implications serves as a critical exercise in understanding the dynamics of risk within an ever-evolving market landscape.


